Trending
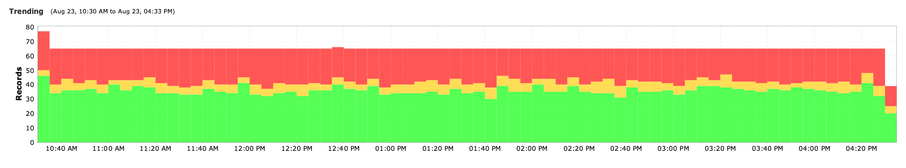
The trending section displays a time-series chart depicting the aggregated health values for all tests. Right click on the chart to select among Reset Zoom, Most Successful/Warnings/Errors report, Save Image.
Reset Zoom – left click and drag to zoom the trending chart to the area selected. Use the Reset Zoom to return to the default view.
Most Successful, Warnings or Errors Report— depending on the color selected (green, yellow or red), LiveNX generates an IP SLA Overall Health report sorted by Normal in highest to lowest order if you right clicked in the green area, Warning in highest to lowest order if you right clicked in the yellow area, and Errors in highest to lowest order if you right clicked in the red area.